


News & Updates, Uncategorized
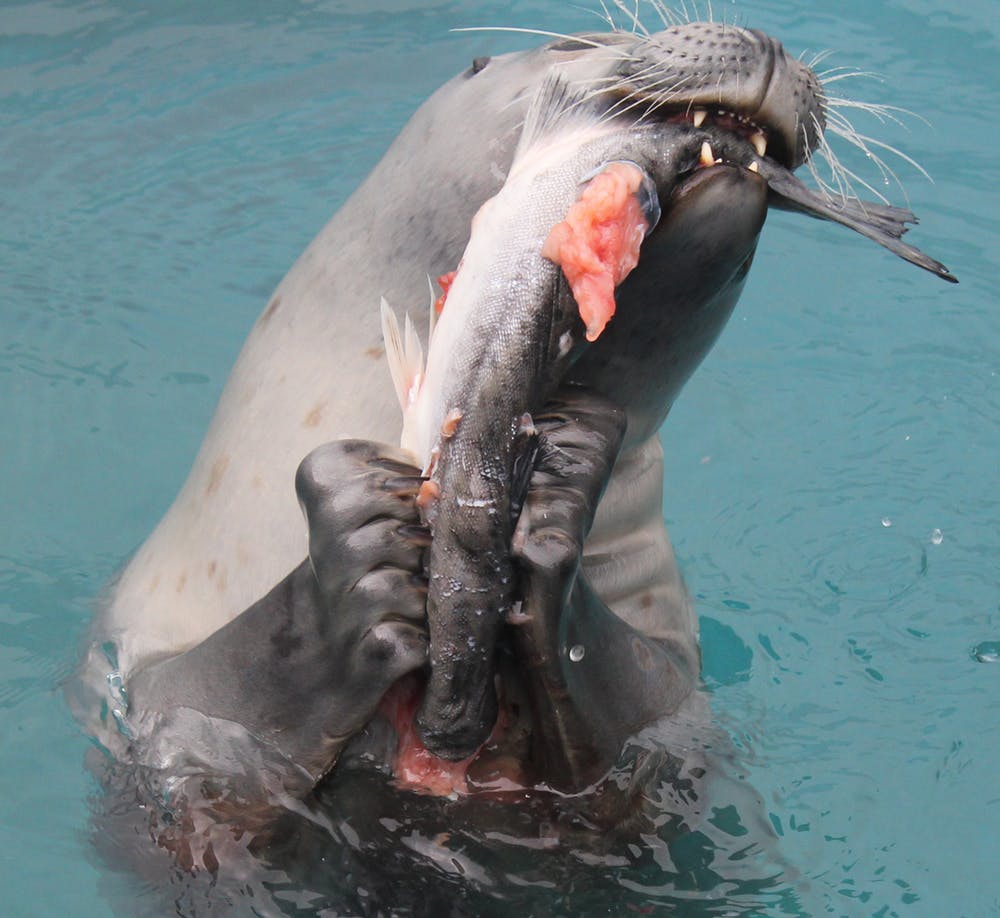
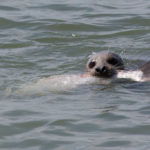
Are Seals and Sea Lions hindering the recovery of Salmon?
01
Dec
Dec
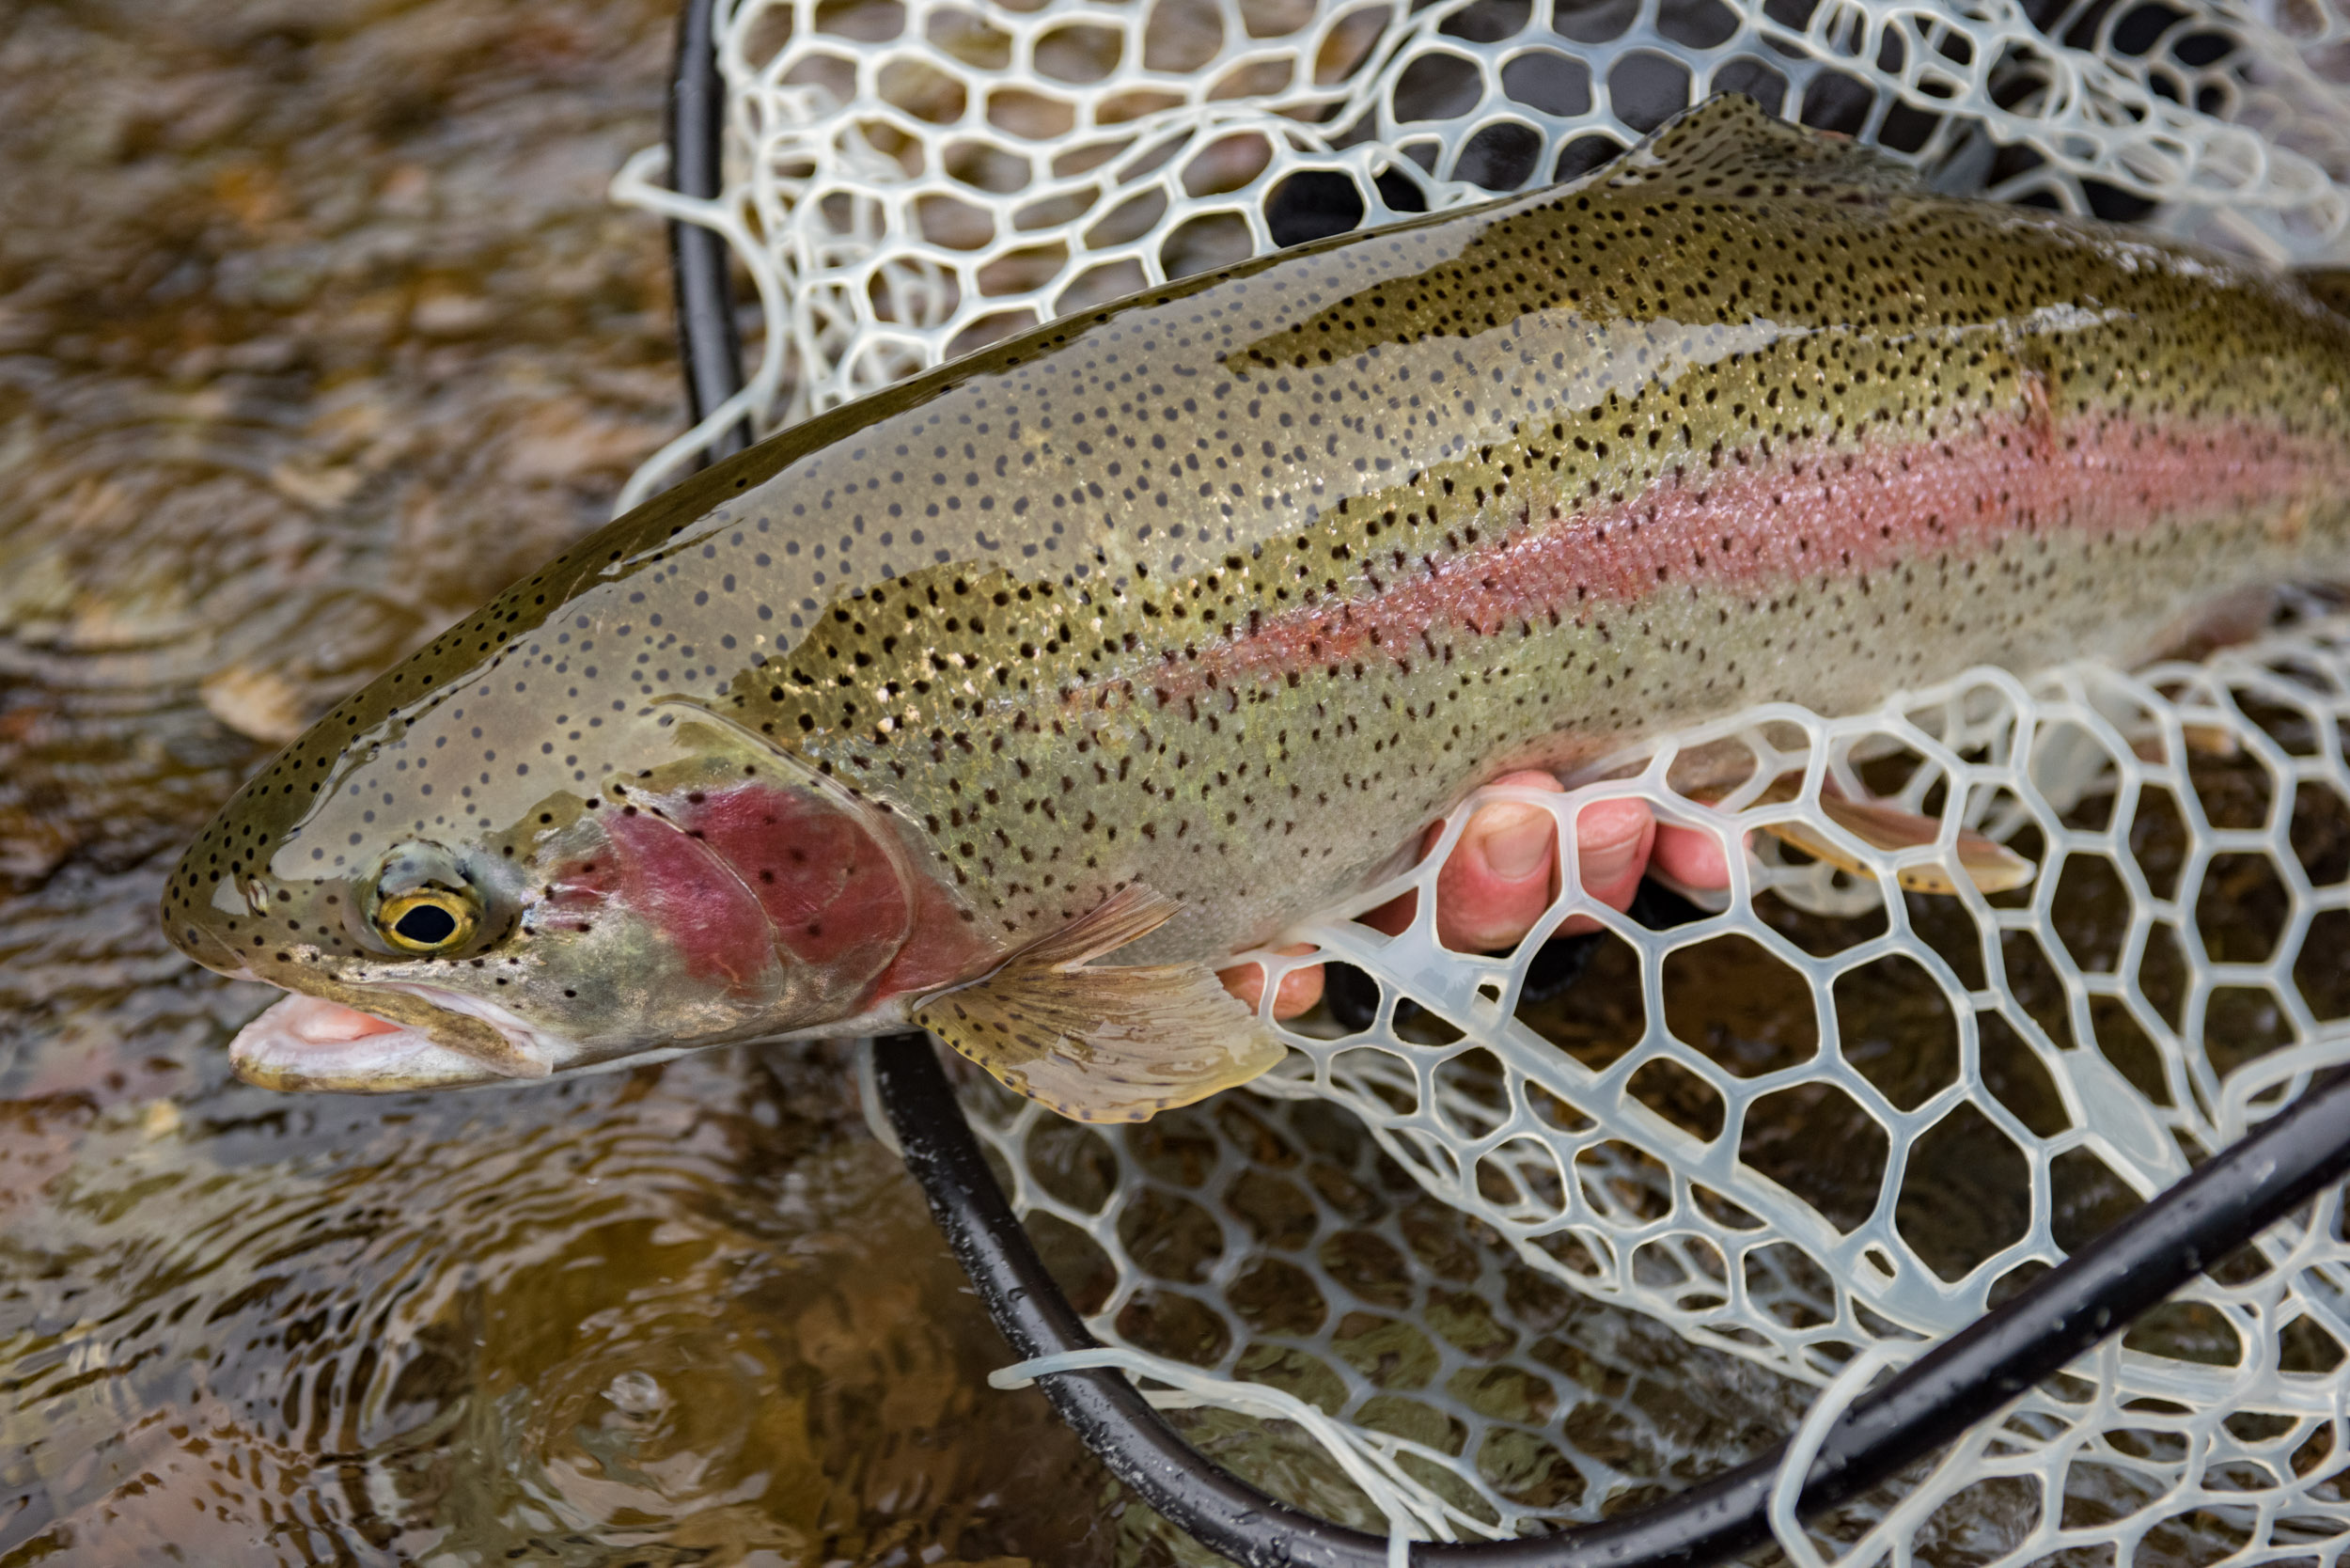
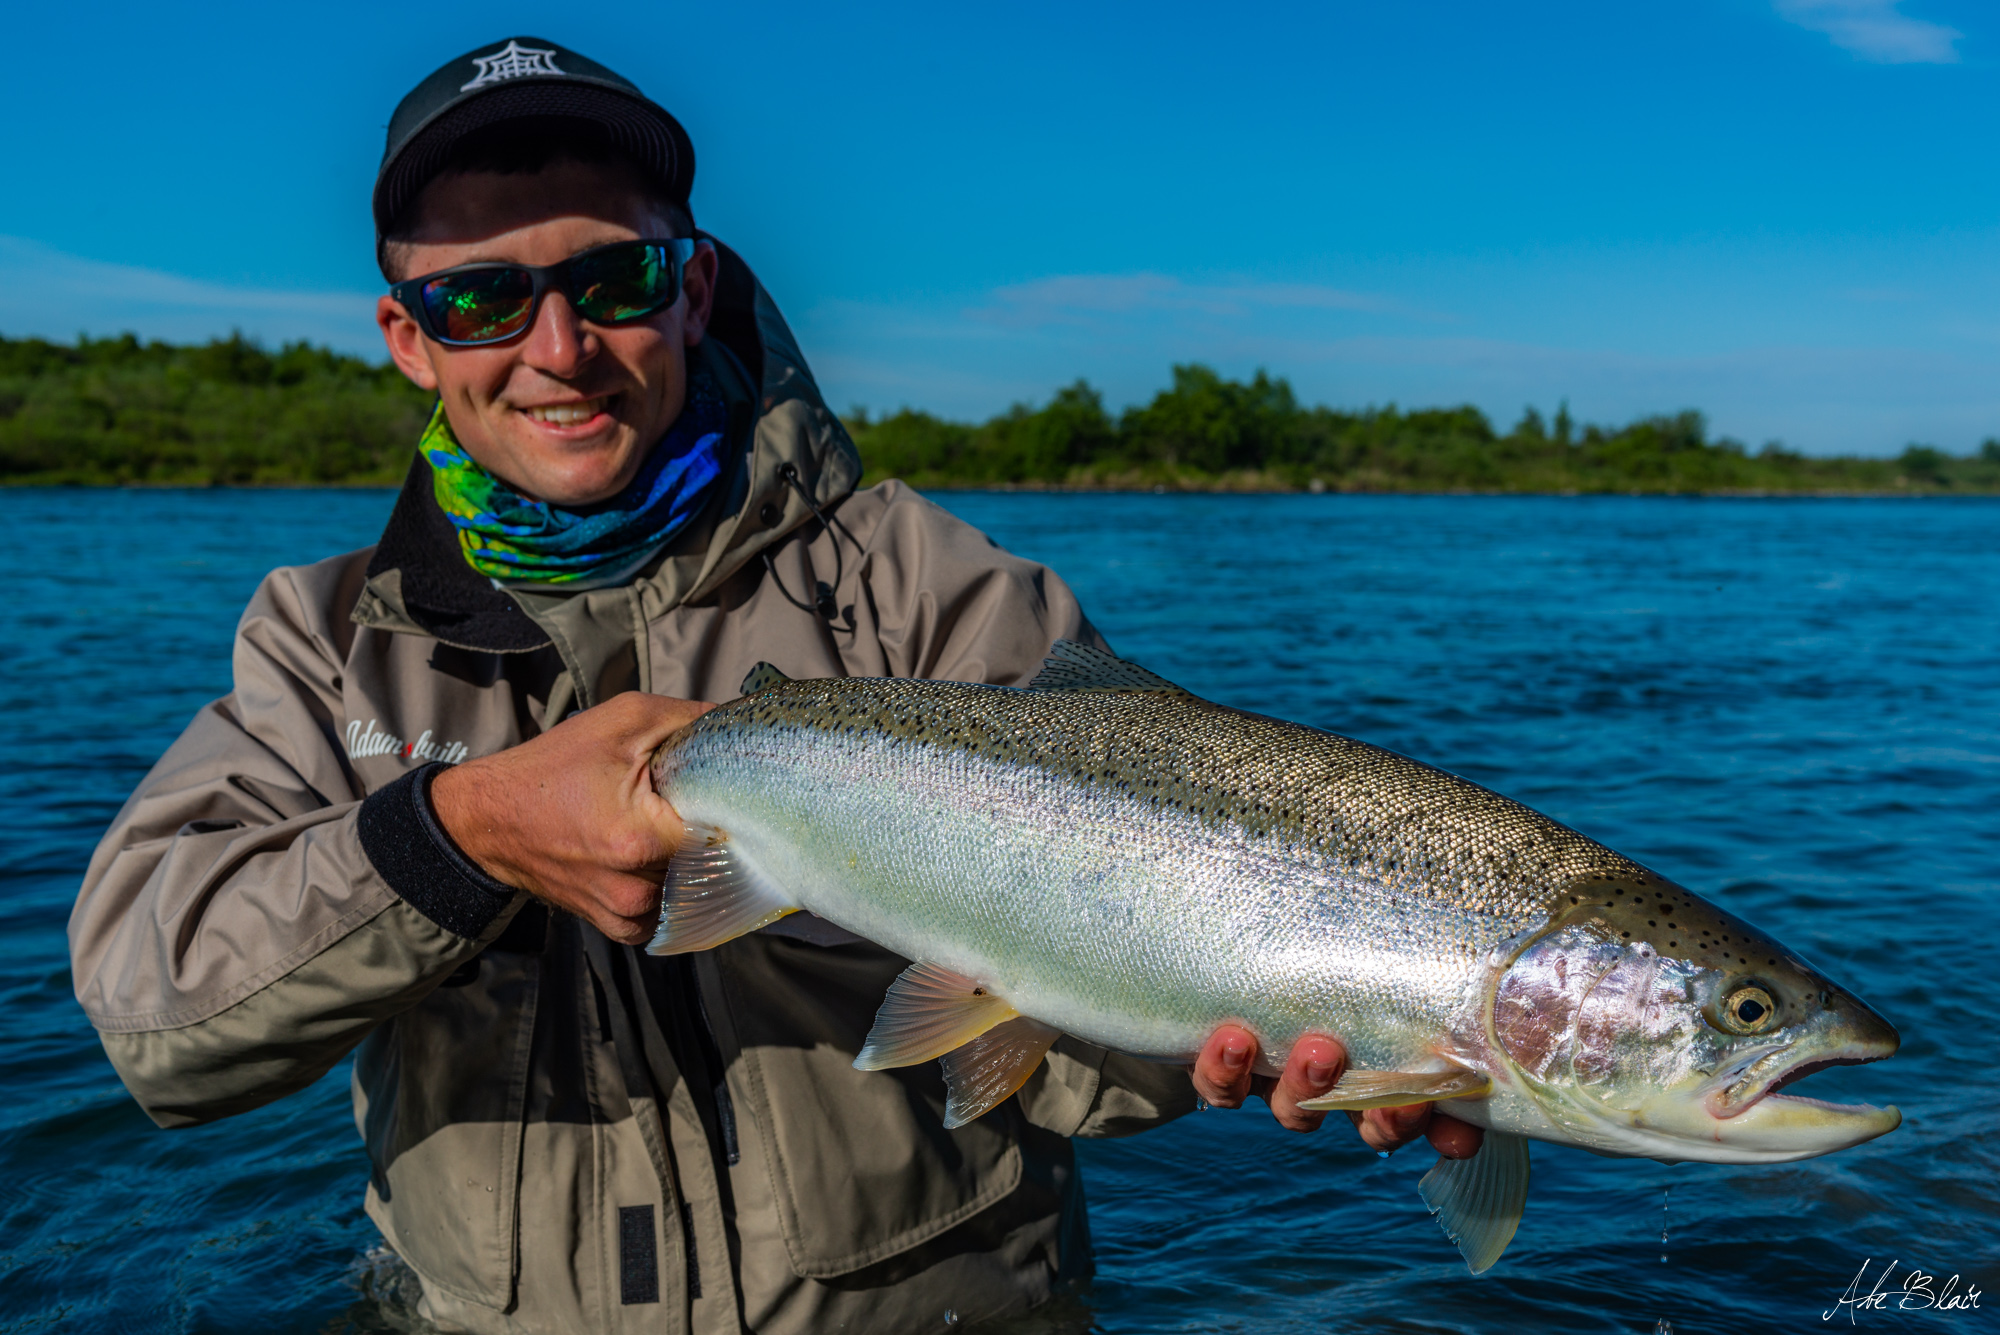
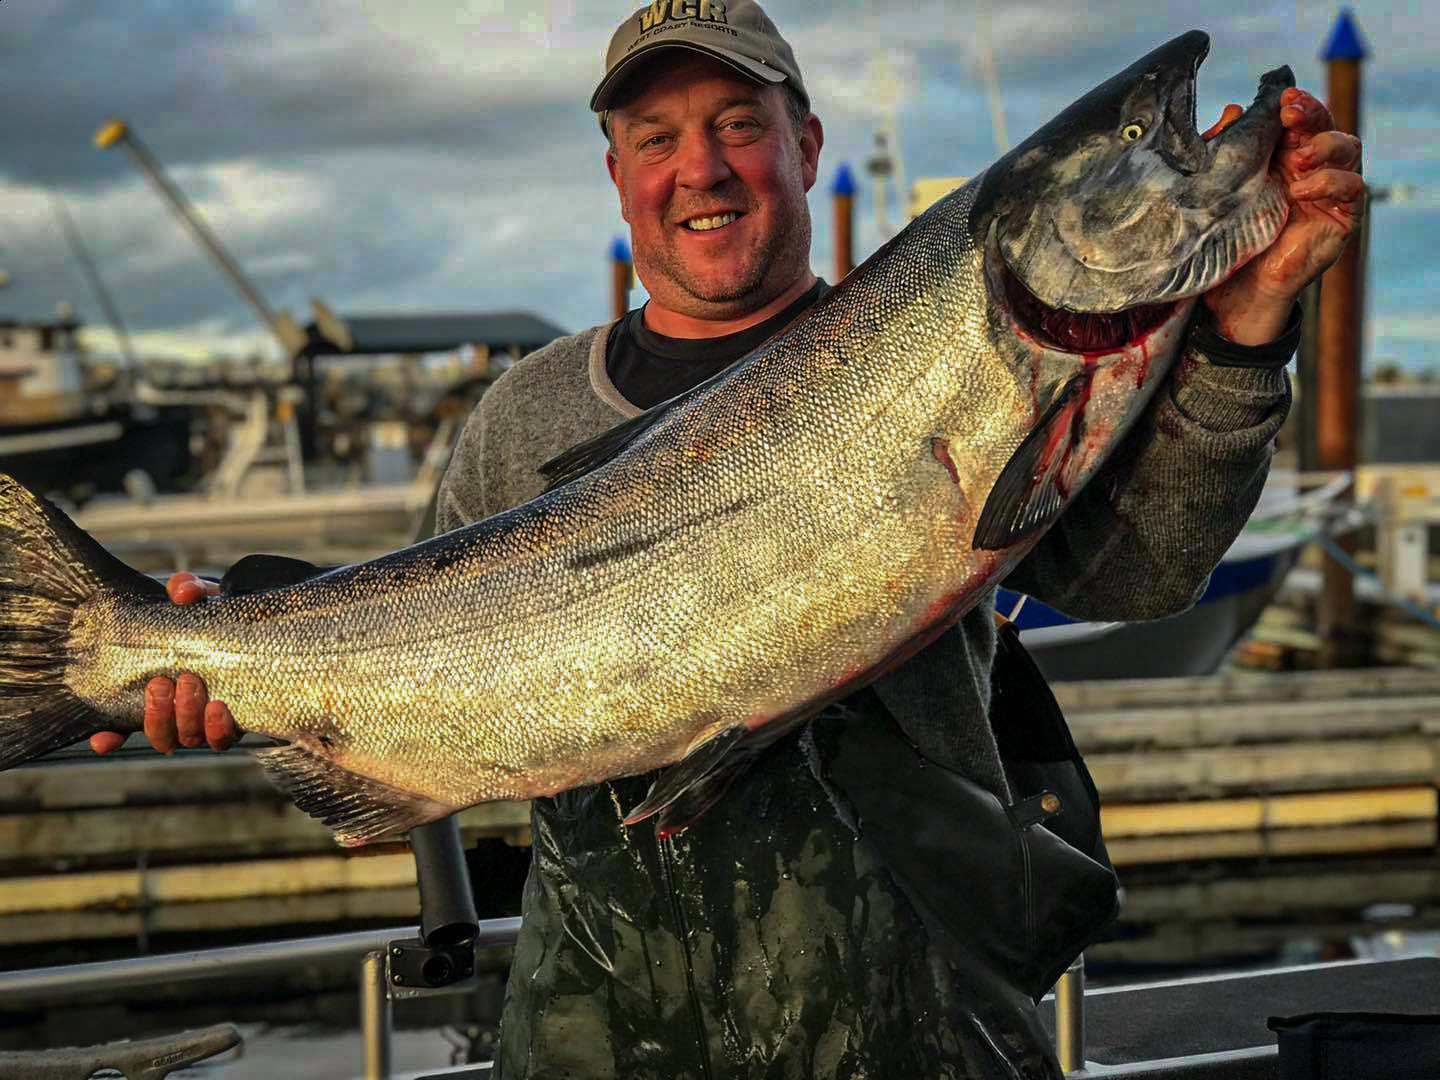
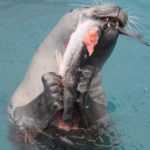
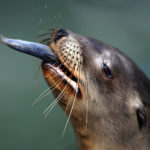
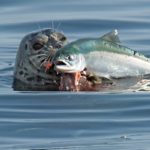
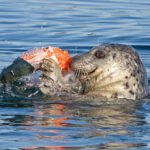
How much Salmon do Seals and Sea Lions really eat?
For as long as I can remember, the focus on our dwindling stocks of Pacific Salmon, particularly Chinook and Coho has been around the usual culprits.
Logging, urbanization of streams, pollution of the various waterways, both fresh(spawning streams and rivers) and salt, over fishing, lack of proper management of the various user groups taking advantage of over harvesting due to lack of surveillance ( I e. over limits by sporties, poaching by various groups at the mouths of spawning streams and in the rivers and streams, poor management of actual “real numbers” of over fishing quotas, and lack of current accurate numbers of spawners returning to all of our spawning systems, and the list goes on.
My thoughts were aroused after thoroughly reading the following papers.
1. The current Salish Sea Marine Survival Project on Predation by Ben Nelson, et all.
2. Seals and sea lions may be slowing salmon recovery, hurting Orcas. By
Chistopher Dunagan.
3. Several papers posted in the Columbia Basin Report.
4. An extensive paper presented by the Gill Netters Association in the late
1900’s
5. Brandon E.Chasco et all NOAA
6. Dr.Walters et all Oceans and Fisheries at UBC
7. Pacific Salmon Foundation Salish Sea Marine Survival Projects
8. Peter Olesiuk Oceans and Fisheries at UBC
Several very significant scientifically proven facts stand out and run a common thread through the above papers.
1.Harbor seals, protected by the Marine Mammal Protection Act of 1972 have nearly doubled in numbers in the inland waterways since 1972—going from 210,000 to 355,000 On the North East Pacific they grew from 350,000 to 1,126,469
2.California sea lions grew from 5,900 to 47,000 3. Stellar sea lions increased from 74,400 to 78,500 4 Transient Orcas grew from 294 to 644 5 In the Salish Sea the Harbour Seal population grew from 8,600 in 1975 to 80,000
I’ll summarize the numbers from the Gill Netter Association. These numbers come from D.F.O. publications, of which I have the copies.
HARBOR SEALS POPULATIONS
1. North coast Pacific: 1987 – 350,000 1997 1,126,469
2. B.C. Coast: 1987 1997 209210 current numbers are stated at 355,000.
3. Georgia Straight: 1987 12,500 1997 40,250 current numbers are 45,000
FUR SEAL POPULATIONS
1. North East Pacific 1987 900,000 1997 2,898,000
CALIFORNIA SEA LIONS
1. North East Pacific 1984 120,000 1997 333,600
2. B.C. Coast 1984 4500 2015 47,000
STELLAR SEA LIONS:
1.North East Pacific 1984 200,000 1997 556,000
2. B.C. Coast 1984 13,000 2015 78,500
FOOD CONSUMPTION OF THE ABOVE GROUPS.
I have not found any written evidence of the break down of their food groups.
I am using the consumption numbers published in the above papers. For Harbour seals,they range from 5lbs/day to 14/lbs/day
The consumption numbers for California sea lions range from 30lbs/day to 50lbs/day.
The numbers for Stellar sea lions ranged from 40 to 60lbs/day
The numbers for Fur seals was stated at 5.5lbs/day
For simplification of the math I used the following rounded consumption numbers
1. Harbour Seals 10 lbs/day
2.California Sea Lions 40lbs/day
3.Stellar Sea Lions 50lbs/day
4.Fur Seals 5lbs./day
The consumption math falls into place as follows for the current time period
Species Herd size Pounds/day total lbs./day
Harbour seals 1,126,469 10 11,264,690
California lions 339,600 40 13,584,000
Stellar lions 356,000 50 17,800,000
Fur Seals 2,898,000 5.5 15,939,000
That does not include the consumption by Orcas (664 outside 70 inside)
Grand totals: 58,587,690lbs/day!!
Totals per month (assume 30 day month) 1,757,631,000 lbs/mo
That is 878,810 tons/mo.
1 current seine boat can hold 55 tons which equals 15,978/boat loads/mo!!
For sake of argument lets assume that that consumption rate is 50% of various salmons ( Chinook, coho, sockeye, pinks, chums, steel head) which is most likely a low number.
The numbers for salmon consumption ( remember no Orcas included here)
would be: 439,405 tons/mo
Again for easy math, lets assume the average weight of
salmon to be 10 lbs. There for consumption of salmon in this
analysis would be: 4,394,050 salmon/mo!!
WONDER WHERE OUR SALMON ARE DISAPPEARING TO???
The growth rate of the seals and sea lions et all averages 10% plus ( compounded)/year and the production of salmon is not even close to keeping up to this number.
Now we add in the destruction ( consumption) caused by seal predation on smolts in the estuaries to this mix.
Dunagan states the production of Chinook smolts alone in the West Coast area, including hatcheries and wild is 29,000,000.
He also states that the consumption of Chinook smolts to be 85% or 24,000,000.
Similar current studies ( as stated above) on the Big Qualicum, Cowichan and Puntledge show that the seal predation to be 1 kg/seal/day of coho smolts. At 2g/smolt that is 100 coho smolts/day x how many seals ?
The above study ( of which the P.S.F. was also involved) did not include Chinook.
These are staggering numbers and need to be addressed as soon as possible.
Is it a wonder that our resident Orcas are short on their favorite meal of chinooks???
Your thoughts, please
Written By: Ken Pearce
Founder of The Pacific Balance Pinnipeds Society
by Brian Oakland